

OpenAI Serves 800M Users with One Postgres Database. Here's What Most Teams Get Wrong About Scaling.
Routing strategies, production landmines, and the 9 rules that prevent replica failures. A deep dive into Level 2 of the scaling ladder.


I keep seeing teams reach for distributed databases, microservices, and sharding at the first sign of traffic. They read about how some company processes millions of requests and assume they need the same architecture. They do not. What they need is discipline with the fundamentals.
OpenAI published an engineering article last week about how they scale PostgreSQL [1]. They scaled a single primary PostgreSQL instance with nearly 50 read replicas across regions, plus PgBouncer as a proxy layer for pooling.
The same topology you would find at a Series A startup, executed with discipline.
They grew 10x in the past year. Their response was not to rewrite everything. They optimized application logic, tuned database parameters, scaled up vertically & added read replicas. When they finally did need to offload some workloads, they moved only the shardable, write-heavy pieces to a different system (Azure Cosmos DB). The core stayed on PostgreSQL.
This is not a story about PostgreSQL being magic. It is a narration about mastering each level of scaling before jumping to the next one.
Where We Left Off
Last week I wrote about REVA’s database meltdown during a Binance campaign(Read it here). Our Postgres instance buckled under traffic we thought we were ready for. Response times went from milliseconds to 20 seconds. Users bounced. Our partner channels became crisis rooms.
That article covered two foundational layers of database scaling.
Layer 0: Query Optimization. We fixed ILIKE wildcards with trigram indexes. We replaced OFFSET pagination with cursor-based pagination. We ran EXPLAIN ANALYZE on our hot paths and eliminated the obvious bottlenecks.
Layer 1: Connection Management. We deployed PgBouncer with transaction pooling. We did the connection math and realized we had been running dangerously close to our limits. Connection setup latency dropped from 20 seconds to under 100 milliseconds .
These fixes stabilized our system. But they are also table stakes. Every production database eventually needs query optimization and connection pooling. What separates teams that scale gracefully from teams that hit walls is what happens next.
The Scaling Ladder
Here is the mental model I use when thinking about PostgreSQL scaling. Each rung represents a class of intervention, ordered roughly by complexity and when you should reach for it.
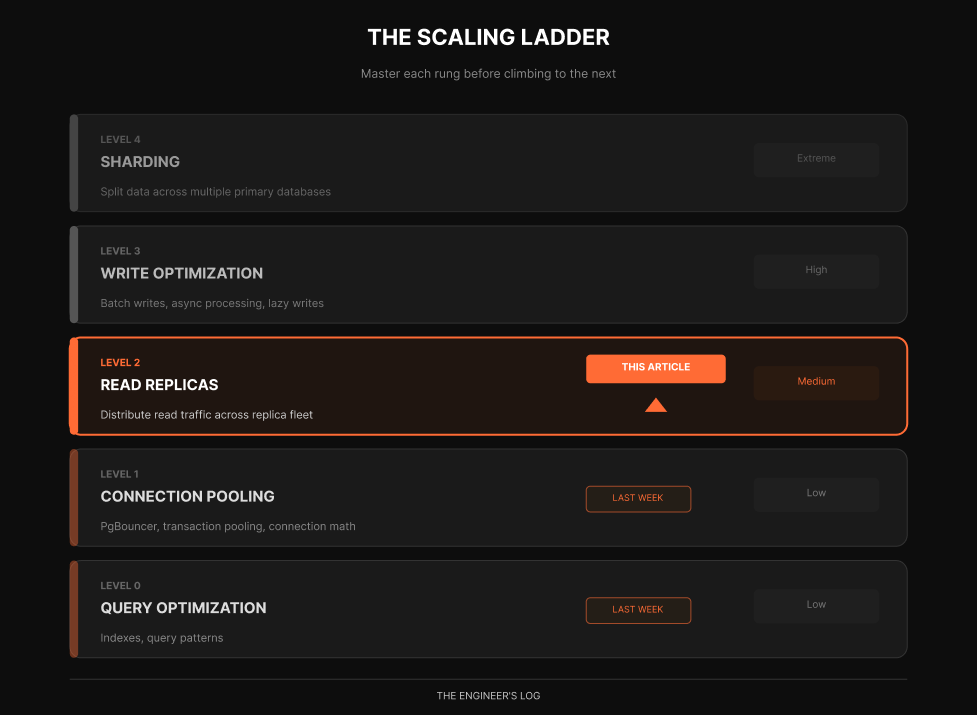
Most web applications are heavily read-dominant. John Nunemaker once observed GitHub.com is probably ~97% reads [2], and industry practitioners commonly observe ratios between 70-95% reads depending on the application type.[2]. OpenAI confirms this pattern. They have a read-heavy workload, which is why scaling reads with replicas has been their primary lever.
This ratio is why read replicas are such a powerful scaling tool. You are optimizing for the majority of your traffic without touching the complexity of distributed writes.
This article focuses entirely on Level 2. We will go deep on read replicas. Not the surface-level advice of “add a replica and route reads,” but the actual decisions, tradeoffs, and gotchas that determine whether your replica strategy helps or creates new problems.
How Replication Actually Works
Before we talk strategy, let us make sure we understand the mechanics.
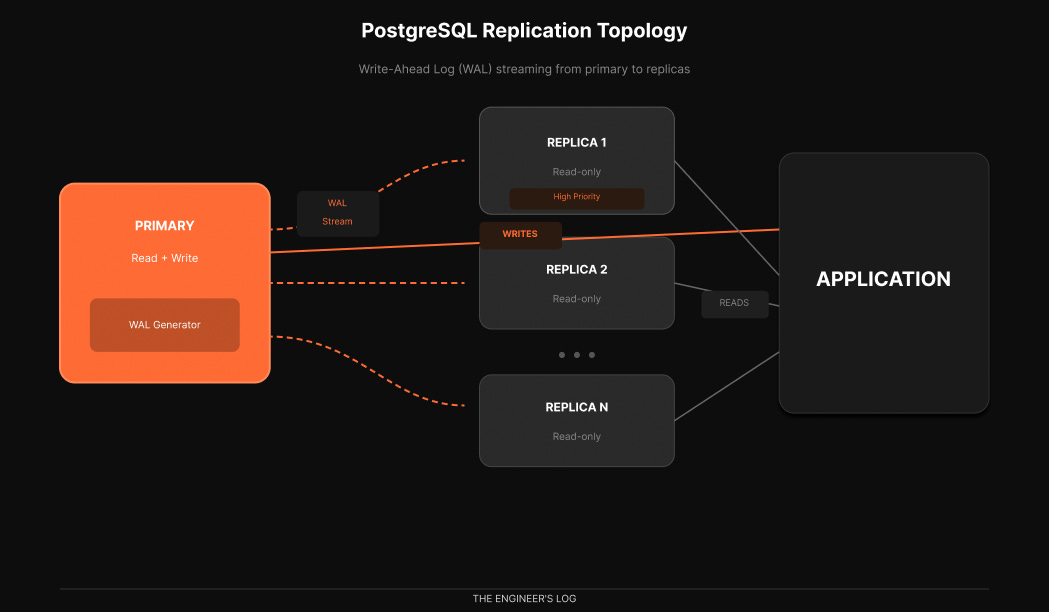
PostgreSQL replication works through the Write-Ahead Log, or WAL. Every change to your database gets written to the WAL before it is applied to the actual data files. This is how Postgres guarantees durability. If the server crashes, it can replay the WAL to recover [3].
Replication exploits this mechanism. The primary server streams its WAL to replica servers, which replay those same changes to maintain synchronized copies of the data.
There are two replication modes that matter in practice.
Synchronous replication. The primary waits for at least one replica to confirm it received and wrote the WAL before acknowledging the transaction to the client. This guarantees zero data loss but adds latency to every write [3].
Asynchronous replication. The primary streams WAL continuously but does not wait for confirmation. Writes are faster, but there is a window where replicas might be behind. If the primary crashes, the most recent transactions might not exist on replicas yet [3].
Most production deployments use asynchronous replication. OpenAI does [1]. The performance benefit outweighs the small risk window, especially when you have multiple replicas providing redundancy.
What about high availability for the primary itself? OpenAI uses a hot standby [2]. This is a replica that does not serve active traffic. Writes go to primary and synchronously replicate to this hot standby. If primary goes down, hot standby takes its place immediately. Dead simple failover.
Try It Yourself: Automated Failover with Patroni
Use Patroni’s docker-compose example for a lab, service names differ by repo/version. Patroni is the industry-standard HA solution, used by GitLab, Zalando, and many others [4][5].
Here is a minimal experiment you can run in about 30 minutes:
# Clone the official Patroni examples
git clone https://github.com/patroni/patroni.git
cd patroni/docker

# Start a 3-node cluster with etcd
docker-compose up -d

# Check cluster status
docker exec -it demo-patroni1 patronictl list

# You should see one Leader and two Replicas
Now simulate a failure:
# Stop the leader node
docker stop demo-patroni1

# Watch automatic failover happen
docker exec -it demo-patroni2 patronictl list

# One of the replicas is now the new Leader
The entire failover happens in seconds. Patroni handles leader election through etcd, promotes the healthiest replica, and reconfigures the cluster automatically [4]. This is significantly more robust than older approaches like keepalived, which required manual scripting and could not handle split-brain scenarios reliably.
For an even simpler setup, pg_auto_failover offers a two-node minimum with a monitor process [6]. It requires less infrastructure than Patroni (no external etcd cluster) but offers less flexibility. Both are actively maintained and support PostgreSQL 13 through 18.
The Routing Decision
Adding replicas is easy. The hard part is deciding which queries go where.
The naive approach is simple: writes go to primary, reads go to replicas. But this breaks down quickly because of replication lag. There is always some delay between when a write commits on the primary and when it becomes visible on replicas.
Consider this sequence:
1. User creates a new post         → INSERT on PRIMARY
2. User is redirected to view it   → SELECT on REPLICA
3. Post does not exist yet         → User sees empty page
4. User refreshes                  → Post appears
5. User files a bug report         → You debug for hours
This is the read-after-write consistency problem. The user wrote data and immediately tried to read it back, but the replica had not caught up yet.
Four Routing Strategies
Strategy 1: Route by Operation Type
The simplest approach. All writes to primary, all reads to replicas. This works for queries that can tolerate slight lag: analytics dashboards, search results, recommendation feeds, historical reports.
Operation                         Destination      Notes
─────────────────────────────────────────────────────────────────
INSERT / UPDATE / DELETE          Primary          Always
SELECT (analytics)                Replica          Can tolerate lag
SELECT (user dashboard)           Replica          Usually fine
SELECT (right after user write)   Primary          Needs consistency
SELECT (inside a transaction)     Primary          Must see own writes
Strategy 2: Session-Based Routing
Track whether a session has performed a write recently. If yes, route all subsequent reads to the primary for a short window, typically 5 to 30 seconds. After that window, resume routing reads to replicas.
def get_connection(session, query_type):
    if query_type == 'write':
        session.last_write_time = now()
        return primary_pool.get_connection()

    # If user wrote recently, read from primary
    if session.last_write_time:
        if (now() - session.last_write_time) < CONSISTENCY_WINDOW:
            return primary_pool.get_connection()

    return replica_pool.get_connection()
This handles read-after-write consistency automatically. The tradeoff is that heavy writers route more reads to primary, potentially negating some replica benefits.
Strategy 3: Explicit Read Preferences
Give developers explicit control over consistency requirements per query. This is what MongoDB calls read preferences. Many PostgreSQL ORMs now support similar patterns.
# Strong consistency required
user = await db.user.find(
    where={'id': user_id},
    read_preference='primary'
)

# Eventual consistency acceptable
posts = await db.post.find_many(
    where={'published': True},
    read_preference='replica'
)
This gives maximum flexibility but requires developers to think about consistency on every query. Works best for teams with strong database literacy.
Strategy 4: Lag-Aware Routing
Monitor replication lag in real time and route reads to replicas only when lag is below a threshold. If lag spikes, automatically fail over reads to the primary.
Is this a write?
    → YES → PRIMARY
    → NO  → Check replica lag
                → Lag < 100ms → REPLICA (round-robin)
                → Lag >= 100ms → PRIMARY (preserve capacity)
This is sophisticated but requires infrastructure to monitor lag continuously. Tools like ProxySQL, PgPool-II, or HAProxy with health checks can implement this pattern [7].
Workload Isolation: The Noisy Neighbor Problem
OpenAI does not treat all read traffic equally.
When every API endpoint hits the same database infrastructure, any change upstream can have catastrophic effects on the data layer. A cache miss causing synchronous load. An expensive multi-table join saturating CPU. A new feature launch spiking traffic. These are all noisy neighbor problems.
OpenAI’s solution, workload isolation through dedicated replica pools.
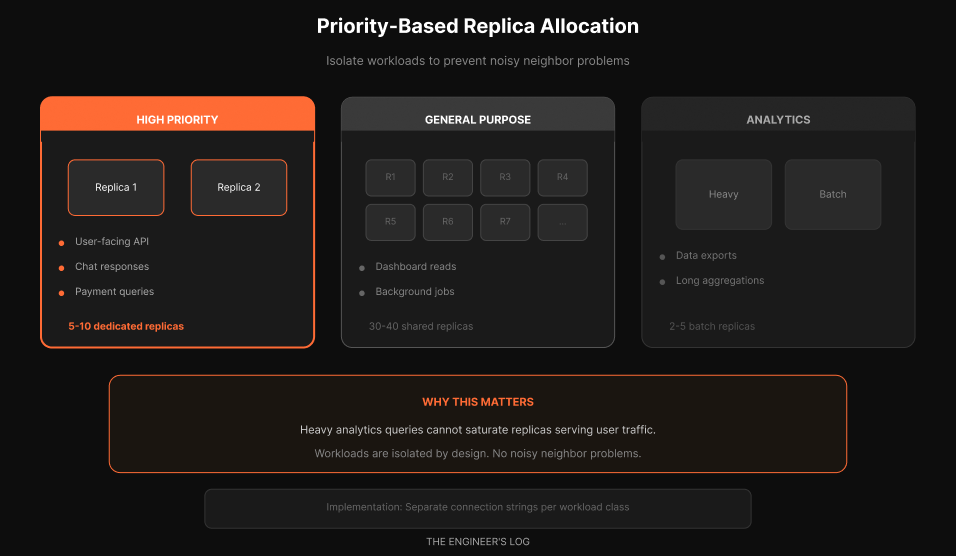
They distinguish between low-priority and high-priority requests. For high-priority requests, they allocate dedicated read replicas. This prevents low-priority traffic from impacting critical paths.
High-priority pool. User-facing API calls. Chat responses. Payment queries. Anything with an SLA. These get dedicated replicas that are never shared with batch workloads.
General-purpose pool. Dashboard reads. Background jobs. Internal tools. These share a larger pool of replicas and can be oversubscribed.
Analytics pool. Data exports. Long-running aggregations. Heavy queries that would saturate CPU. These get isolated replicas sized for batch workloads.
The implementation can be as simple as separate connection strings:
const connections = {
  primary: process.env.DATABASE_PRIMARY_URL,
  replicaHighPriority: process.env.DATABASE_REPLICA_HP_URL,
  replicaGeneral: process.env.DATABASE_REPLICA_GENERAL_URL,
  replicaAnalytics: process.env.DATABASE_REPLICA_ANALYTICS_URL
};
This prevents the nightmare scenario where an engineer runs a heavy analytics query that saturates the replica pool, causing latency spikes for user-facing traffic.
The Replication Lag Reality
Let us talk about the number that determines whether your replica strategy succeeds or fails: replication lag.
In theory, asynchronous replication should be nearly instantaneous. WAL records stream continuously. Replicas apply them as fast as they arrive. Under light load, lag is often measured in milliseconds.
In practice, several factors cause lag to spike.
Cause What Happens Typical Impact Heavy write bursts WAL generation outpaces streaming Seconds to minutes Large transactions Replicas must replay entire transaction Proportional to size Replica under-provisioned CPU or IO cannot keep up with replay Persistent lag Network congestion WAL streaming throttled Milliseconds to seconds Long queries on replica Replay blocked by read locks Minutes in worst case Vacuum operations Heavy IO competes with replay Seconds
OpenAI mentions they maintain replication lag near zero with fifty replicas [1]. This is not trivial. At that scale, the primary generates significant WAL volume, and all fifty replicas need to receive and replay it.
Monitoring Lag
You need visibility. Without it, you are flying blind.
On the primary, query pg_stat_replication:
SELECT
    client_addr,
    state,
    pg_wal_lsn_diff(sent_lsn, replay_lsn) / 1024 / 1024 AS replay_lag_mb
FROM pg_stat_replication;
On the replica, check how far behind it is:
SELECT
    CASE
        WHEN pg_last_wal_receive_lsn() = pg_last_wal_replay_lsn() THEN 0
        ELSE EXTRACT(EPOCH FROM now() - pg_last_xact_replay_timestamp())
    END AS lag_seconds;
Set up alerts. A replica that is 30 seconds behind is probably fine for analytics. A replica that is 30 seconds behind serving user-facing traffic is a bug waiting to happen.
Designing for Lag
The best systems assume lag exists and design around it.
Do not read your own writes from replicas. After any write, either read from primary or implement session-based routing.
Use timestamps, not sequences, for “latest” queries. If you are showing most recent posts, sort by created_at rather than assuming the highest ID is newest. IDs might appear out of order due to lag.
Make lag visible when appropriate. Some applications show “data as of 5 seconds ago” on dashboards. This sets expectations.
Have a fallback. If replica lag exceeds your threshold, automatically route to primary. Yes, this increases primary load, but it is better than serving stale data.
The WAL Bandwidth Limit
Here is something that is not discussed enough. At extreme scale, the bottleneck shifts from database CPU to WAL distribution bandwidth [2].
When you have one primary and fifty replicas, every byte of WAL needs to reach fifty destinations. PostgreSQL handles this reasonably well, but physics eventually wins.
Consider the math. If your primary generates 50 MB/s of WAL during peak, and you have 50 replicas, you are looking at 2.5 GB/s of network egress from the primary just for replication.
At these volumes, you start caring about network interface capacity, WAL compression (available in PostgreSQL 15+), and cascading replication [3].
Cascading Replication
OpenAI mentions they are testing cascading replication [1][2]. This is not yet deployed in production, but it is their path forward if they need more read scale.
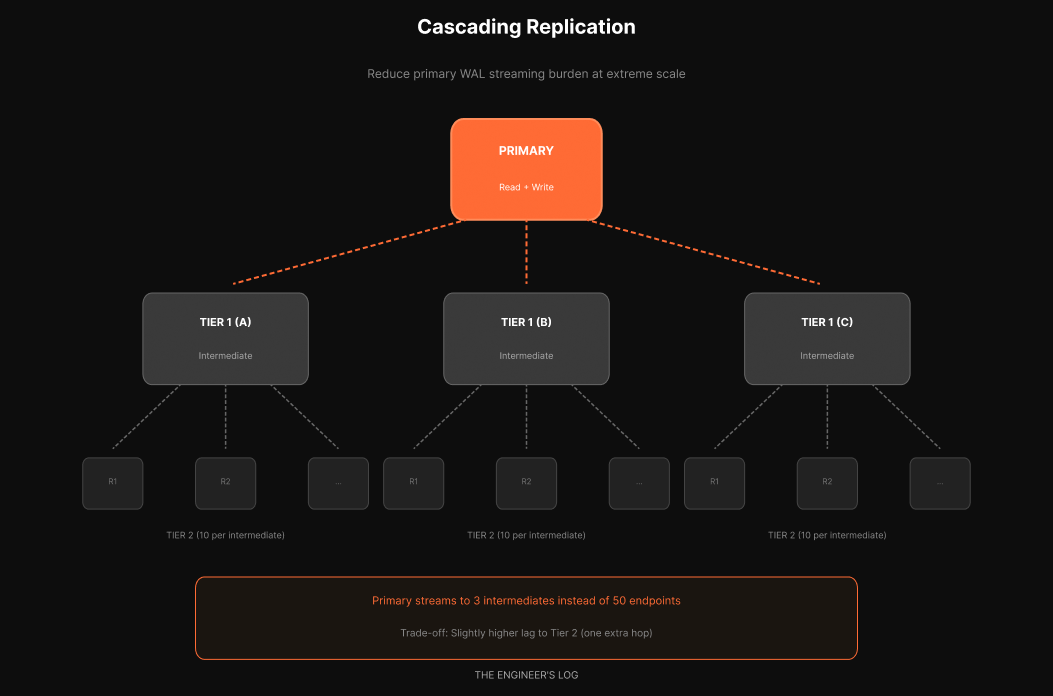
Instead of the primary streaming to all fifty replicas, it streams to a few intermediate replicas. Each intermediate then streams to a set of read replicas.
If the primary had a 50-replica limit and you used 5 intermediates, each intermediate could have 10 read replicas behind it. You get 50 read replicas with only 5 streaming connections from the primary.
The tradeoff: slightly higher lag to tier-2 replicas since they are one hop further from the source. For most read workloads, this is acceptable. Multi-tier read replicas are common at scale.
What OpenAI Did Beyond Replicas
They fixed bugs causing redundant writes. Sometimes the biggest wins come from not doing unnecessary work [2].
They implemented lazy writes. Whatever does not need to happen in real time should not happen in real time. They batch writes asynchronously to reduce primary load [2].
They added rate limits to protect the database. If your infrastructure cannot handle a traffic spike, it is better to shed load gracefully than let everything collapse [2].
They broke up expensive joins. They had a query joining 12 tables [2]. Twelve. They moved some of that logic to the application layer, replacing one complex join with multiple simpler selects. Those selects can come from replicas or cache, reducing primary burden.
They audited ORM-generated queries. You cannot blindly trust what your ORM generates. N+1 problems, suboptimal query plans, missing index hints [2]. Review the actual SQL hitting your database.
They use cache locking on cache misses. When there is a cache miss, only one request goes to the database to rehydrate the cache. Others wait [2]. This prevents a stampede of identical queries hitting your origin. CDNs use this same pattern.
The 9 Rules for Replica Reads in Production
Replicas look simple on architecture diagrams. In production, they create a new category of failures. Here are the rules that prevent the common landmines.
Rule 1: Never trust cached connection strings during failover
When a replica gets promoted, your application still holds the old connection. DNS TTLs, connection pool caches, and load balancer health checks all lag behind reality.
The pattern: Use a connection proxy (PgBouncer, Odyssey) that health-checks backends every few seconds. Set DNS TTL to 30 seconds or less. Better yet, use Patroni’s REST API or Consul for dynamic endpoint discovery instead of relying on DNS.
The failure mode: Replica promotion happens. Your app keeps sending reads to the old primary (now a replica, or worse, offline). Reads fail or return stale data for 30-300 seconds depending on your TTL.
Rule 2: Your pooler will betray you with prepared statements
PgBouncer in transaction pooling mode cannot track prepared statements across connections. If your ORM (Rails, Django, SQLAlchemy) uses prepared statements by default, you will see sporadic “prepared statement does not exist” errors.
The pattern: Either use session pooling (sacrifices connection efficiency), disable prepared statements in your ORM, or switch to Odyssey/PgCat which handle this better.
# SQLAlchemy: disable prepared statements for transaction pooling

engine = create_engine(url, connect_args={"prepare_threshold": 0})
Rule 3: Not all reads are replica-safe
These reads must hit the primary:
Anything inside a read-write transaction
Auth/session validation (you cannot serve a stale “user is banned” check)
Idempotency key lookups (double-charge risk)
Reads immediately after writes in the same user flow
Payment/balance checks before mutations
Rate limit counters
The pattern: Default to primary. Opt specific queries into replica reads, not the reverse. Document which queries are replica-safe and why.
Rule 4: Schema migrations will spike your lag
DDL replicates through WAL. A 30-second ALTER TABLE on primary means 30 seconds of blocked replay on replicas. During that window, lag spikes and queries may get canceled.
The pattern:
Use
CONCURRENTLYfor index operationsBreak large migrations into small batches
Schedule DDL during low-traffic windows
Monitor replica lag during deploys and pause if it exceeds threshold
The failure mode: You deploy a migration. Replica lag jumps to 45 seconds. Your lag-aware router fails all replicas over to primary. Primary gets crushed.
Rule 5: hot_standby_feedback is a double-edged sword
With hot_standby_feedback = on, replicas tell the primary about their oldest running query. The primary delays vacuum to avoid breaking those queries. Good for query stability. Bad for bloat.
The tradeoff:
ON: Long replica queries will not get canceled. But vacuum bloat accumulates on primary.
OFF: Primary vacuums freely. Long replica queries get “canceling statement due to conflict with recovery” errors.
The pattern: Keep it OFF by default. Set aggressive statement_timeout on replicas (30-60 seconds). If you have legitimate long-running analytics, route them to a dedicated replica with hot_standby_feedback = on and accept the bloat tradeoff on that node.
Rule 6: max_standby_streaming_delay decides who wins
When WAL replay conflicts with a running query, Postgres waits up to max_standby_streaming_delay before killing the query. Default is 30 seconds.
The pattern: For OLTP replicas serving your app, set this low (5-10 seconds). You want lag to stay tight. For analytics replicas, set it higher (300 seconds) and accept the lag.
Rule 7: Measure replica impact, not just replica lag
Before/after metrics that actually matter:
Metric              Where to Measure     Target
────────────────────────────────────────────────────────────────────────

Primary CPU         `pg_stat_activity`   Should drop 30–60%

Read QPS by route   Application APM      Confirm reads shifted

p95 latency (reads) Application APM      Should improve or stay flat

Replica lag (p99)   `pg_stat_replication` < 100ms for OLTP

WAL generation rate `pg_stat_wal`        Baseline for capacity planning

Cache hit ratio     `pg_stat_user_tables`  Shouldstay>99%
If primary CPU did not drop meaningfully, your routing is not working.
Rule 8: Read-only transactions still need care
Explicit BEGIN; ... COMMIT; on a replica is fine. But some ORMs open transactions implicitly. A read-only transaction on a replica that stays open blocks WAL replay for that session.
The pattern: Set idle_in_transaction_session_timeout on replicas (30 seconds max). Audit your ORM’s transaction behavior. Rails’ ActiveRecord and Django both have implicit transaction quirks.
Rule 9: Retry logic must be routing-aware
A read fails on a replica. Your retry logic fires. If it retries on the same lagged replica, it fails again. If it retries on primary, you have just converted a replica failure into primary load.
The pattern: Retries should try a different replica first, then fall back to primary only as last resort. Most generic retry libraries do not understand this. You need routing-aware retry logic or a proxy that handles it.
And remember: replicas scale reads only. If your bottleneck is writes, the next section explains why.
Why PostgreSQL Struggles with Write-Heavy Workloads
Read replicas solve read scaling beautifully. They do nothing for write scaling.
If your bottleneck is write throughput, replicas will not help. Every write still funnels through the single primary. This is exactly the wall OpenAI hit.
PostgreSQL has a fundamental challenge with write-heavy workloads because of MVCC (Multi-Version Concurrency Control) [2][3]. When you update a row, Postgres does not do an in-place update. It creates a new copy of the row. This causes write amplification. If you update the same row multiple times, you create multiple versions. Then vacuuming (garbage collection) needs to clean up the dead tuples. This also causes read amplification because reads must scan through versions to find the visible one.
Under heavy write load at scale, this adds up significantly.
OpenAI’s response was to migrate shardable, write-heavy workloads to Azure Cosmos DB [1]. The core transactional data stays on PostgreSQL. New features that need horizontal write scale go to the sharded system from day one.
The signs that you have outgrown single-primary:
Symptom What Is Happening Primary CPU above 80% despite replicas handling reads Writes dominating CPU Write latency increasing while read latency is stable Primary is write-saturated Replication lag growing despite healthy replicas WAL generation exceeds streaming capacity Autovacuum falling behind Writes generating dead tuples faster than cleanup
When you see these signs, you are entering Level 3 and Level 4 territory. But most teams hit these walls far later than they expect.
The Checklist
If you are running PostgreSQL in production and have not fully exploited read replicas, here is your action plan.
Before You Add Replicas
[ ] Verify you are read-heavy. Run pg_stat_statements analysis. If reads are not at least 70% of your traffic, replicas might not be your highest-leverage move.
[ ] Identify replica-safe queries. Audit your hot paths. Which queries can tolerate a few seconds of lag? Which absolutely cannot?
[ ] Provision replicas appropriately. Replicas that are CPU-bound will lag. Size them to handle your expected read load with headroom.
After You Add Replicas
[ ] Implement routing logic. Start simple and add sophistication as needed.
[ ] Monitor replication lag. Set up dashboards and alerts. Know your baseline.
[ ] Test failover. What happens when a replica dies? What happens when the primary dies? Practice this before it happens in production.
[ ] Consider priority segmentation. If you have distinct workload classes, consider dedicated replica pools.
Ongoing
[ ] Review query routing as your application evolves. New queries appear. Make sure they route appropriately.
[ ] Right-size your replica fleet. Too few and they are overloaded. Too many and you are wasting money.
[ ] Keep replicas close to primary for latency-sensitive reads. Cross-region replicas are useful for disaster recovery but will have higher lag.
The Simplicity Thesis
OpenAI serving 800 million users with a single-primary PostgreSQL deployment is not because they lack the engineering talent to build something more sophisticated. It is a deliberate choice.
They explicitly state that sharding would require changes to hundreds of application endpoints and potentially take months or even years [1]. The return on investment is not there. At least not yet.
The lesson is not “never shard.” The lesson is: master each rung of the scaling ladder before climbing to the next one.
Most applications will never need sharding. They will hit performance problems, panic, and reach for distributed systems when they have not even added a read replica yet. Or they will add replicas but route everything to the primary anyway because implementing proper routing seemed complicated.
Connection pooling. Query optimization. Read replicas. These are solved problems with decades of tooling and best practices. But executing them well requires discipline, measurement, and continuous attention.
OpenAI’s PostgreSQL setup is not interesting because it is exotic. It is interesting because it is not.
What Is Next
This article covered Level 2 of the scaling ladder. There is more ground to cover.
Companies like Notion and Instagram have published detailed accounts of their sharding journeys. Notion split their monolithic PostgreSQL into 480 logical shards across 32 physical databases [8]. Instagram scaled to 500 million users on custom-sharded PostgreSQL clusters [9]. These stories involve different tradeoffs: cross-shard transactions, distributed consistency, operational complexity at a level most teams will never need.
We will explore those patterns in future articles. But I will leave you with this observation: Notion’s retrospective explicitly says they wished they had sharded earlier [8]. Meanwhile, OpenAI with 800 million users is deliberately not sharding their core database [1].
The right answer depends on your write patterns, your consistency requirements, your team’s database expertise, and how much operational complexity you can stomach.
The one universal truth: wherever you are on the ladder, master that rung before reaching for the next one.
References
[1] OpenAI Engineering Blog, “Scaling Postgres to Power 800 Million ChatGPT Users,” January 2026.
[2] John Nunemaker, “Database Performance Simplified,” May 2015.
[3] PostgreSQL Documentation, “High Availability, Load Balancing, and Replication,” PostgreSQL 16.
[4] Patroni Documentation, “Patroni: A Template for PostgreSQL HA,” 2025.
[5] GitHub patroni/patroni, “PostgreSQL High Availability with Etcd, Consul, ZooKeeper, or Kubernetes.”
[6] pg_auto_failover Documentation, “Postgres extension and service for automated failover,” 2025.
[7] PgPool-II Documentation, “Connection Pooling and Load Balancing for PostgreSQL.”
[8] Notion Engineering, “Herding Elephants: Lessons Learned from Sharding Postgres at Notion,” 2021.
[9] Instagram Engineering, “Sharding & IDs at Instagram,” 2012.
This is Part 2 of a series on PostgreSQL scaling. Part 1 covered query optimization and connection pooling during a production incident. Future articles will explore write optimization, autovacuum tuning, and the sharding decision.
Couldn't agree more. This follow-up really amplifies the points from your previous article on REVA's database struggles. It's so insightful to see OpenAI's strategy proving that discipline with fundamental database scaling, like optimization and smart replication, consistantly outperforms premature jumps to distributed systems. A clear roadmap for handling growth, honestly.
Exceptional deep dive into replica strategies. The workload isolation pattern with dedicated replica pools is probaly the most underrated scaling technique because most teams just add replicas without thinking about noisy neighbour problems. I've seen analytics queries crush user-facing traffic countless times before we seperated them. The 9 production rules section is gold, especially the prepared statements trap with PgBouncer in transaction mode.